Using Snapdragon Profiler to Profile Unity App on the Android Platform
0x00 Background
Write a blog today to talk about the profiling tool on the Android platform - the Snapdragon Profiler. Compared with its predecessor Adreno Profiler, Snapdragon Profiler is a substitute for the former and has added support for Vulkan. Therefore, it is recommended that you can use this tool to profile Android devices with Qualcomm chips.
0x01 Installation
This is the download link for Snapdragon Profiler. https://developer.qualcomm.com/software/snapdragon-profiler
However, if you want to run this tool on mac, then it requires a Mono framework, so you also need to download the latest Mono framework: https://www.mono-project.com/download/stable/
At the same time the adb is needed.
0x02 Run
After the installation is complete, you can either click the icon to run, or run it from the command line.
It is recommended to run it from the command line, because there will be some console output, so if there are some exceptions such as no response or crash, you can find the reason in the console.
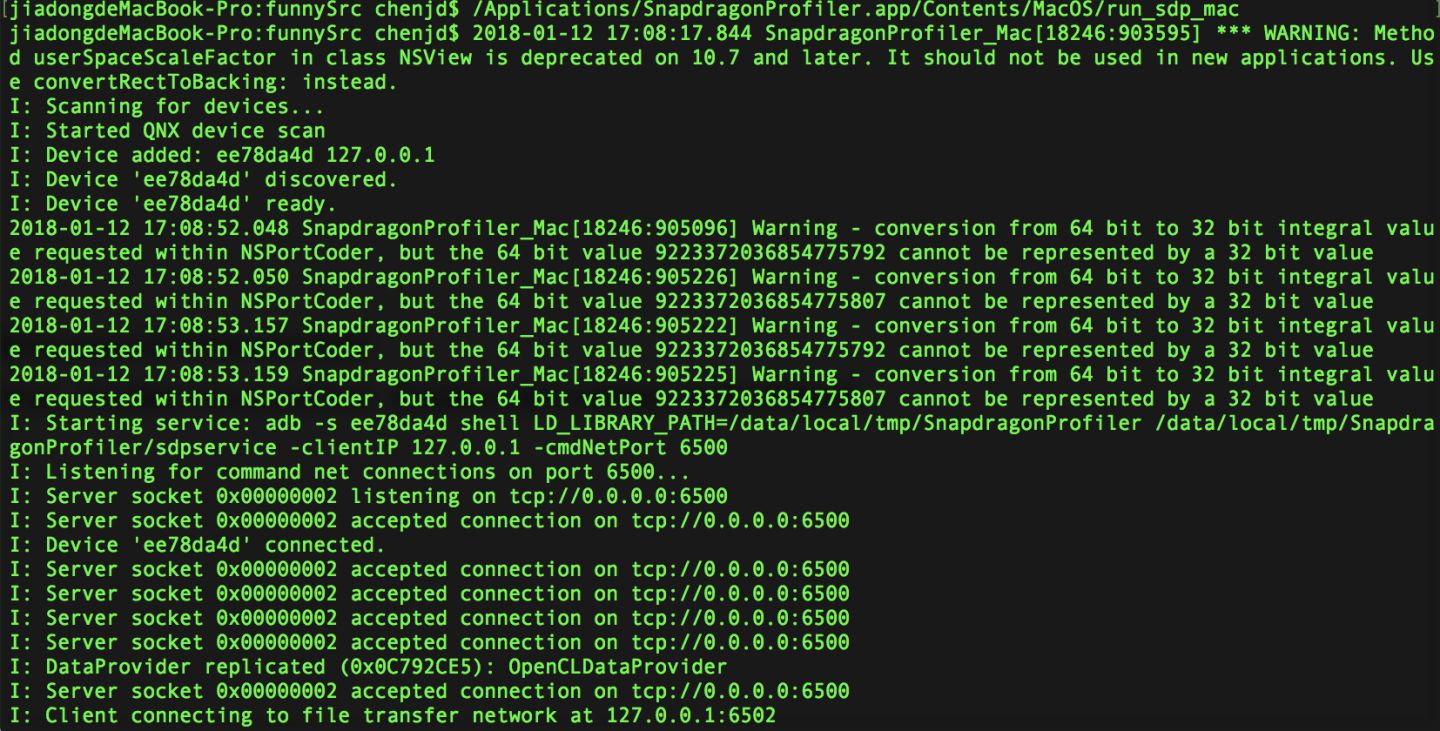
Another reason is that after I clicked the app icon to start the tool, I found that the tool could not detect the device that was connected to the computer, and restarting the adb service was also invalid. After switching to the command line to start the tool, everything is fine.
0x03 Connect the Device
Next, turn on the developer mode of the Android device and connect to the computer. At this time, you can use adb to check whether the device is connected. After that, you can select the connected device on the start page of the Snapdragon Profiler tool. Click “Connect to a Device” to pop up the currently connected device, select the target device and click Connect to establish the connection between the device and the tool.
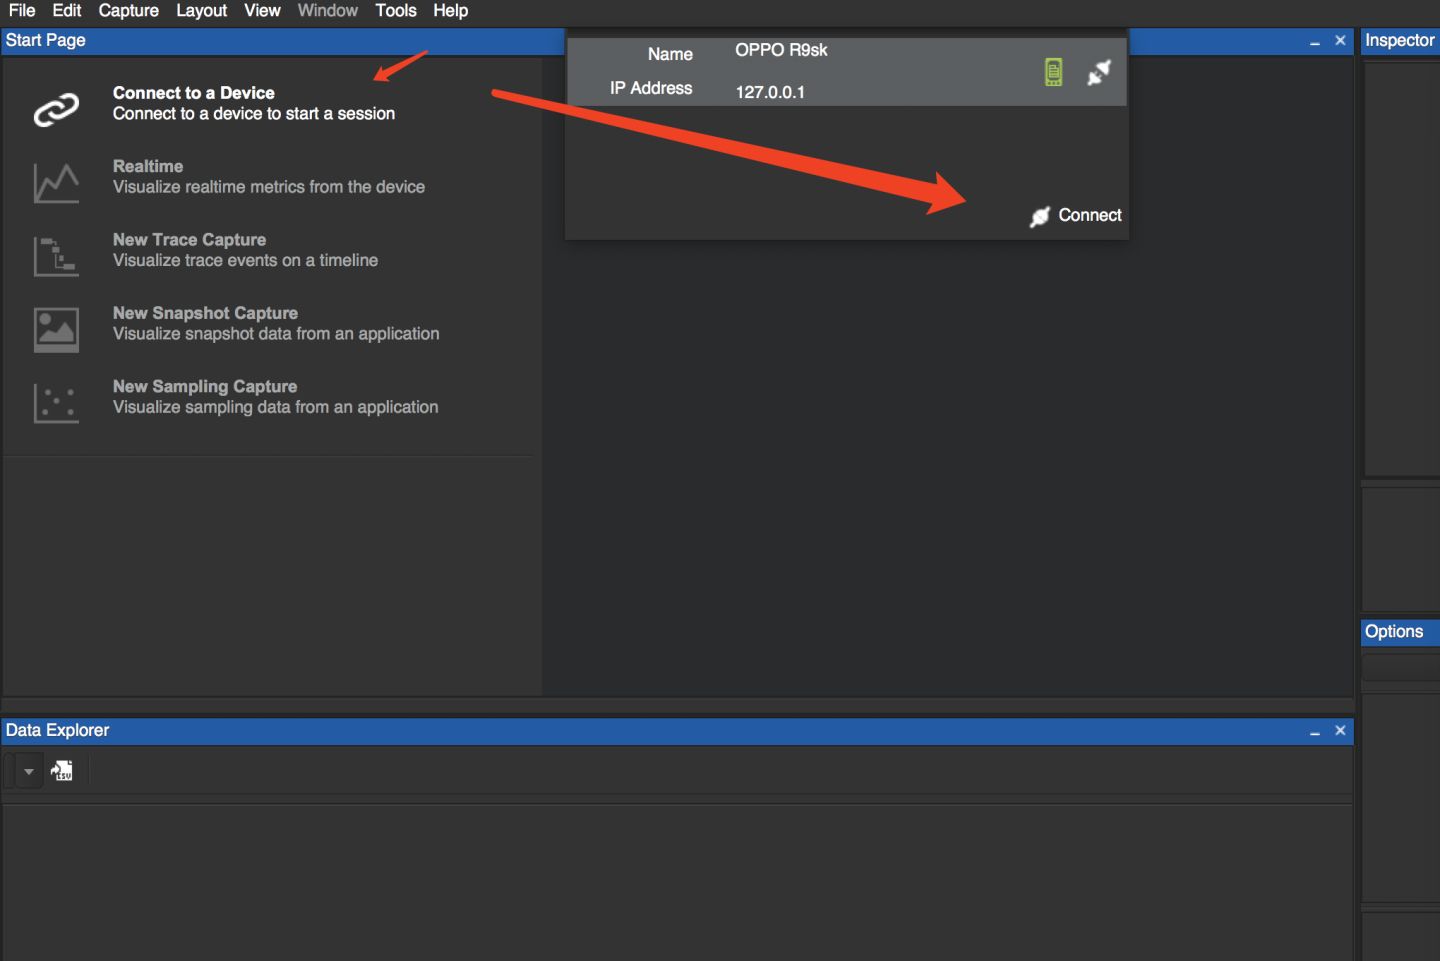
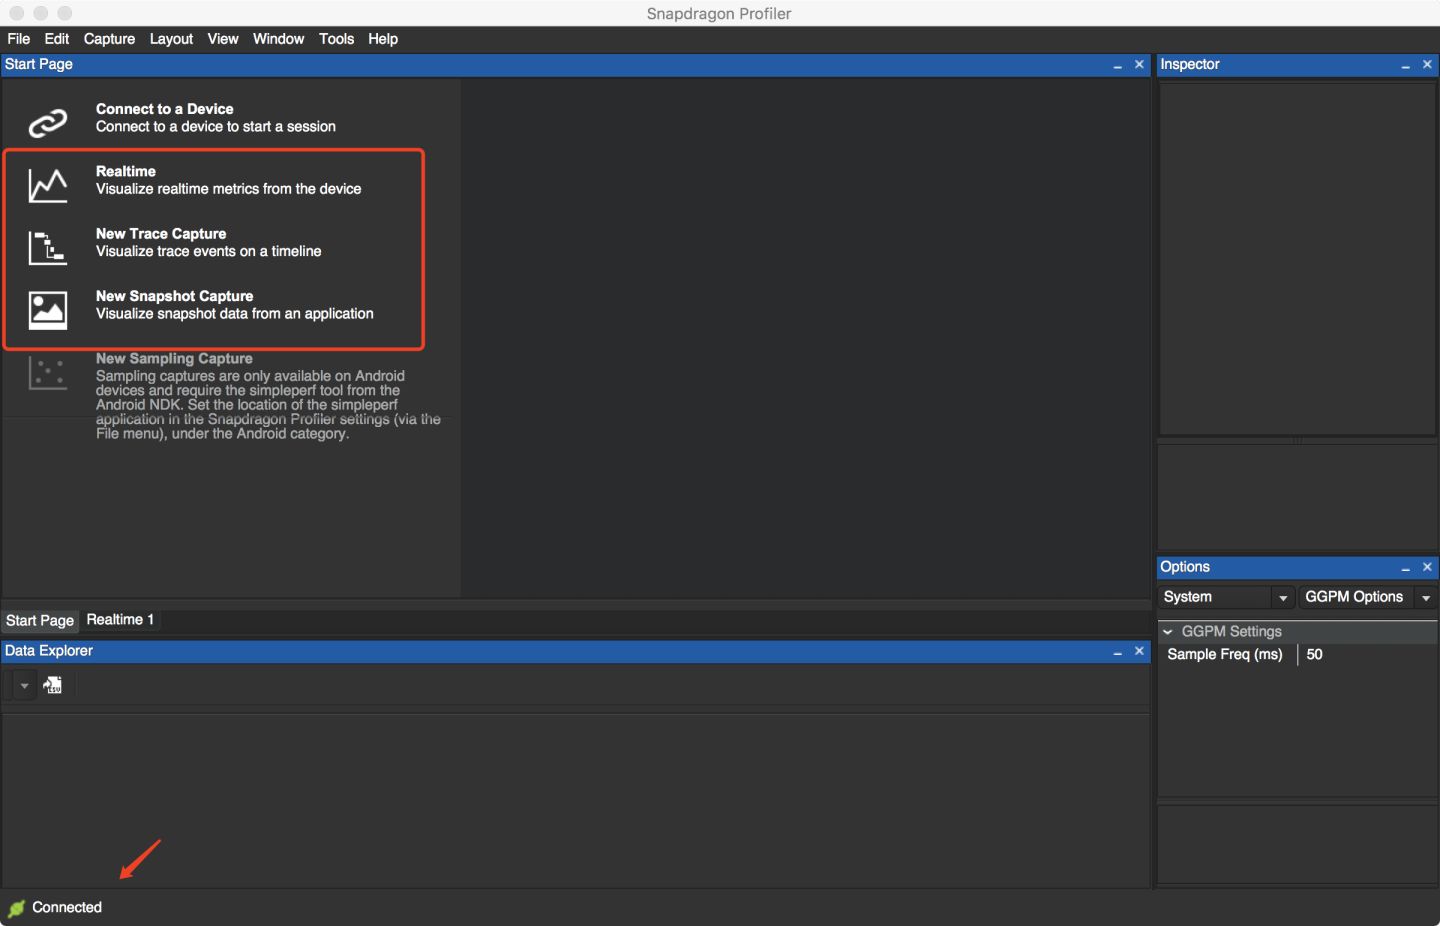
At this time, you can find that the three gray buttons at the top of the page are activated, which are:
- Realtime
- New Trace Capture
- New Snapshot Capture
and you can find the current connection status with the device at the left bottom of this page.
0x04 Real-time performance data (RealTime)
The RealTime mode provides real-time data of the device. We can click on the specific app process to obtain the app process’s performance data, or we can directly obtain the performance data of the entire system.
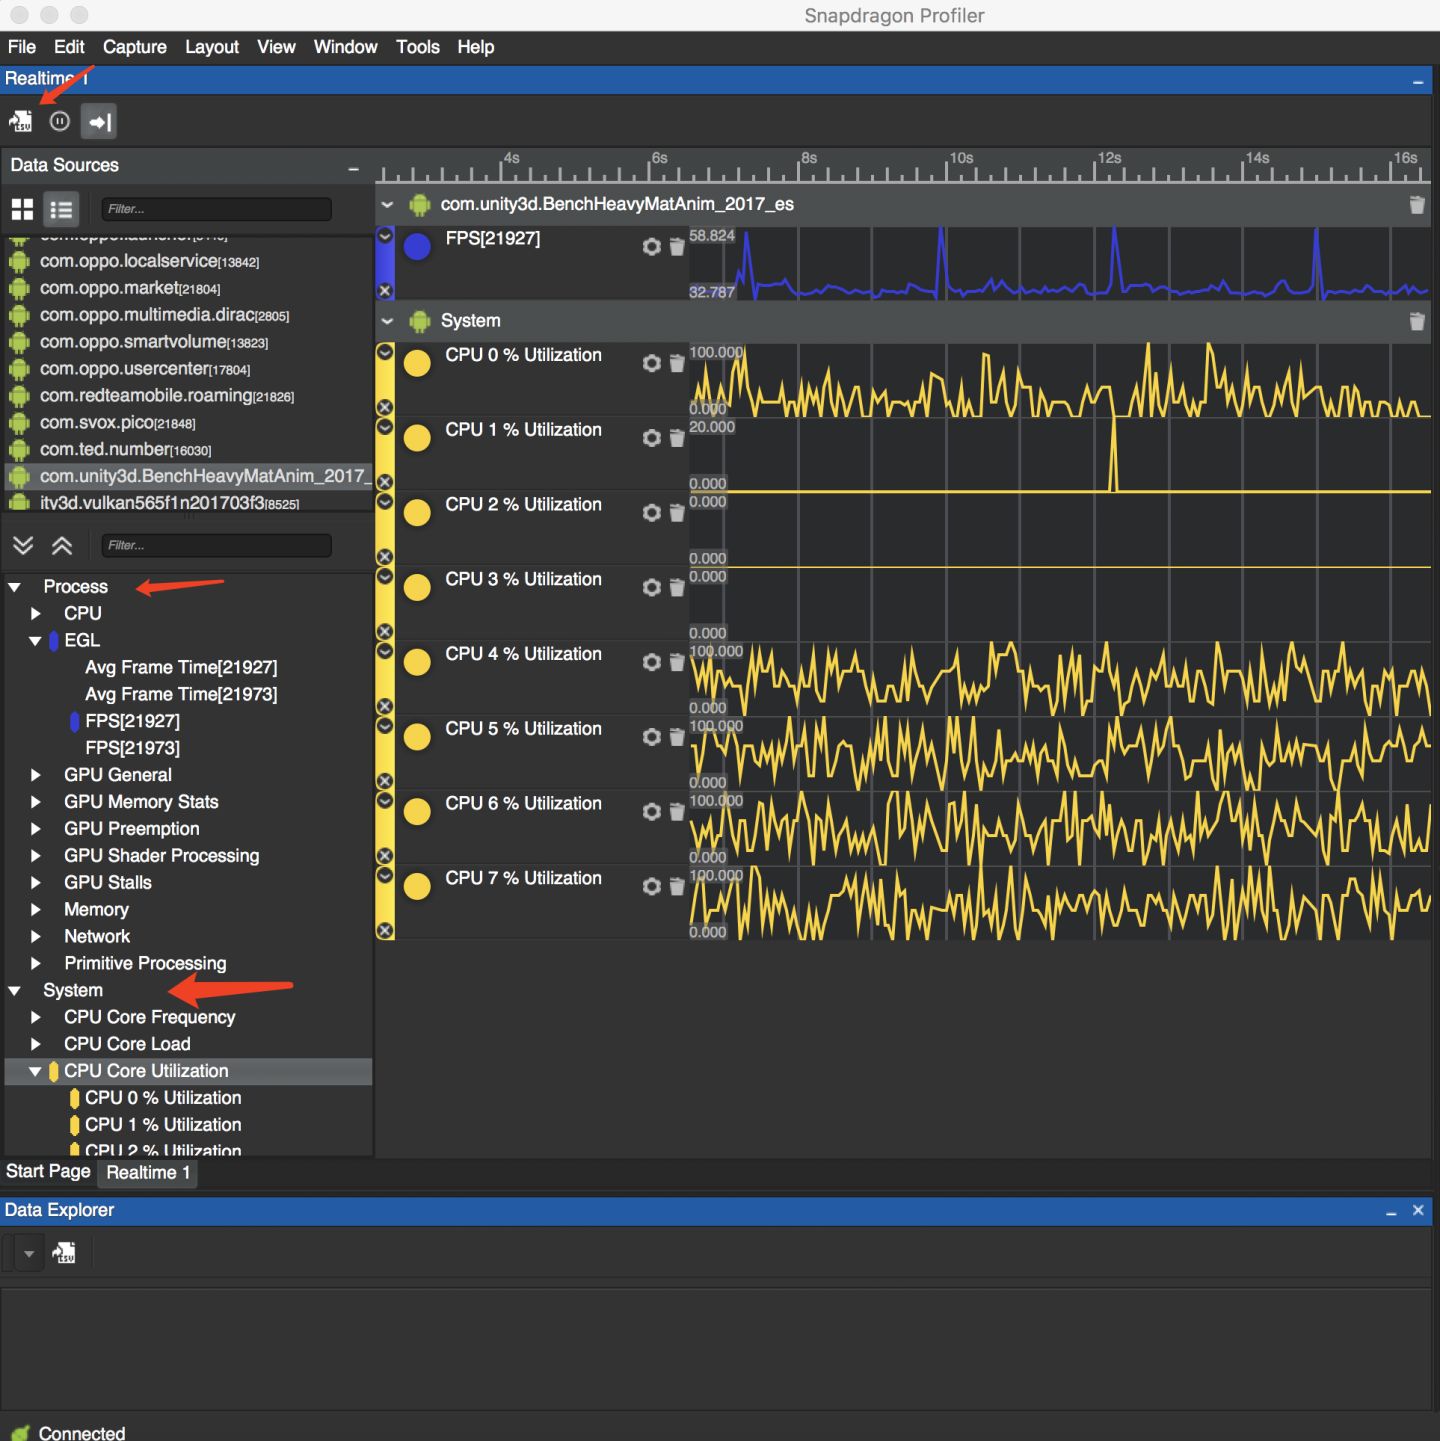
However, it should be explained here that the funciton to get the fps data of the app currently only supports OpenGLES, and does not support Vulkan( V2.1.0.11062017). And you can find the fps data under the EGL entry.
If we want to analyze the data further, we can export the current profiler data. There is a data export icon at the upper left corner, you can export the current profiler data as a csv file.
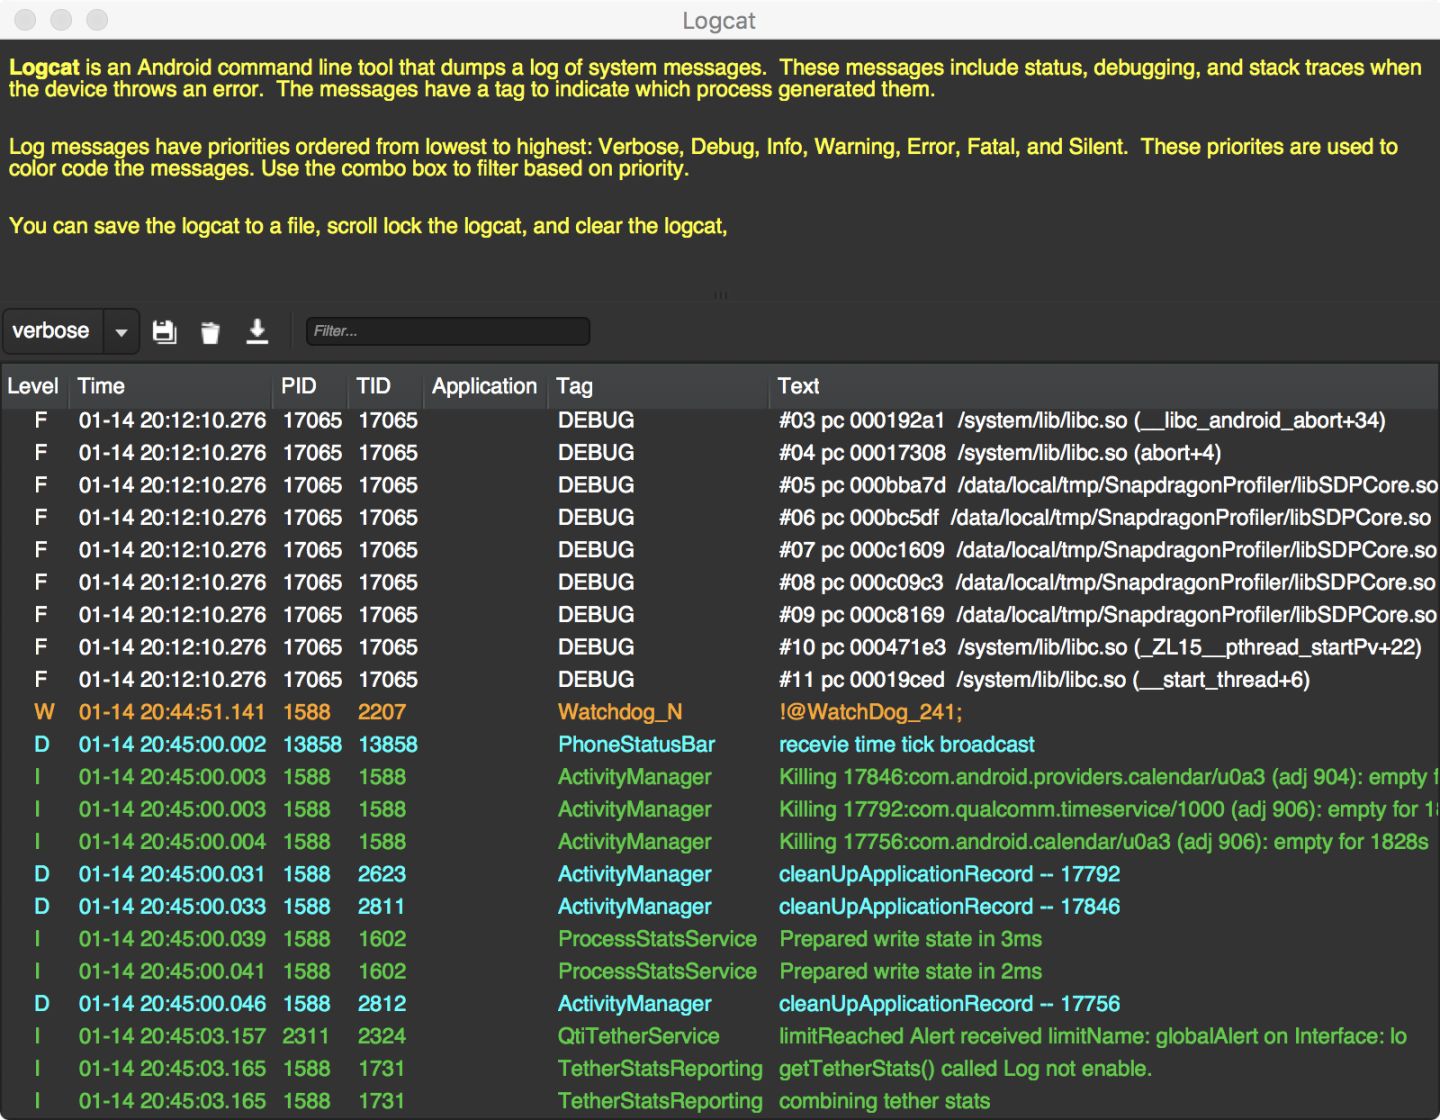
Another point to note is that Snapdragon Profiler also supports logcat output. But it isn’t displayed in the page by default. If you need to open it, you can open logcat in the Tool menu.
0x05 Trace Capture
In addition to viewing real-time data, we can also capture call tracking over a period of time and display it in the form of a timeline.
Starting a Trace Capture is very easy, just click New Trace Capture on StartPage or use New Trace in the Capture menu to create a new Trace.
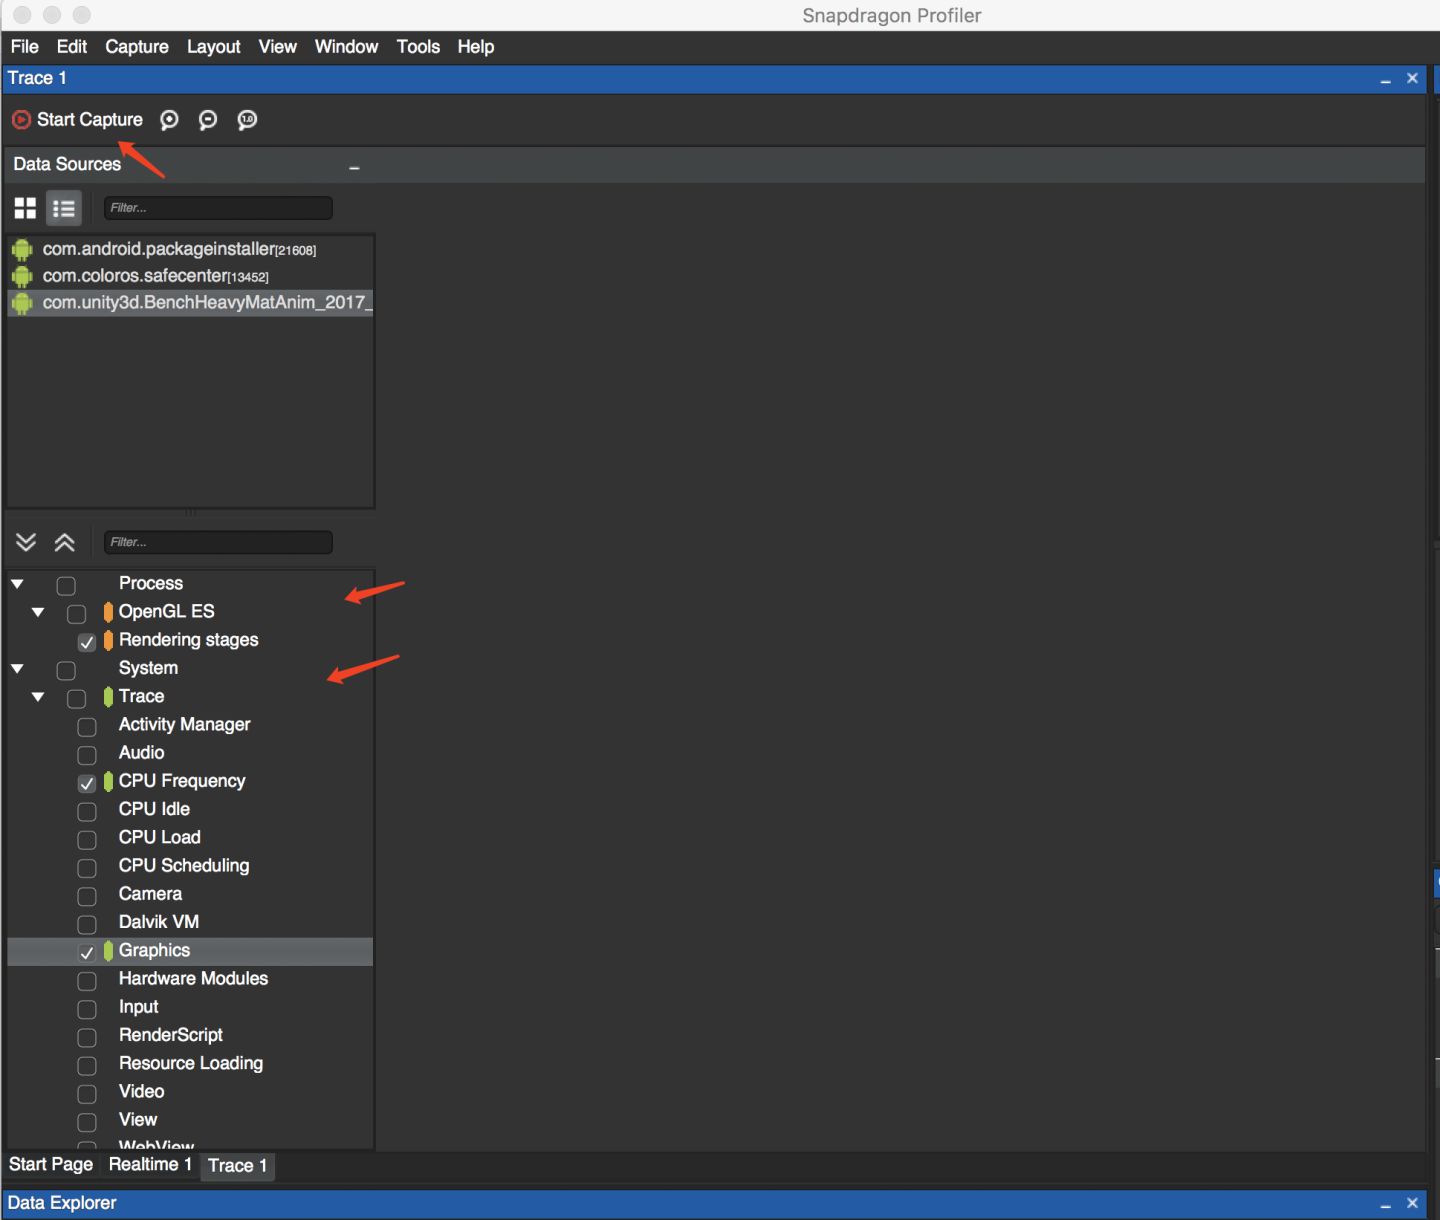
Similar to RealTime Mode, we can also select the performance data of the app or the system we are interested in. After checking the corresponding indicators, click “Start Capture” in the upper left corner to start capturing.
After a few seconds, click Stop Capture to end this capture, then we will get the call tracking within this period and display it in the form of a timeline.
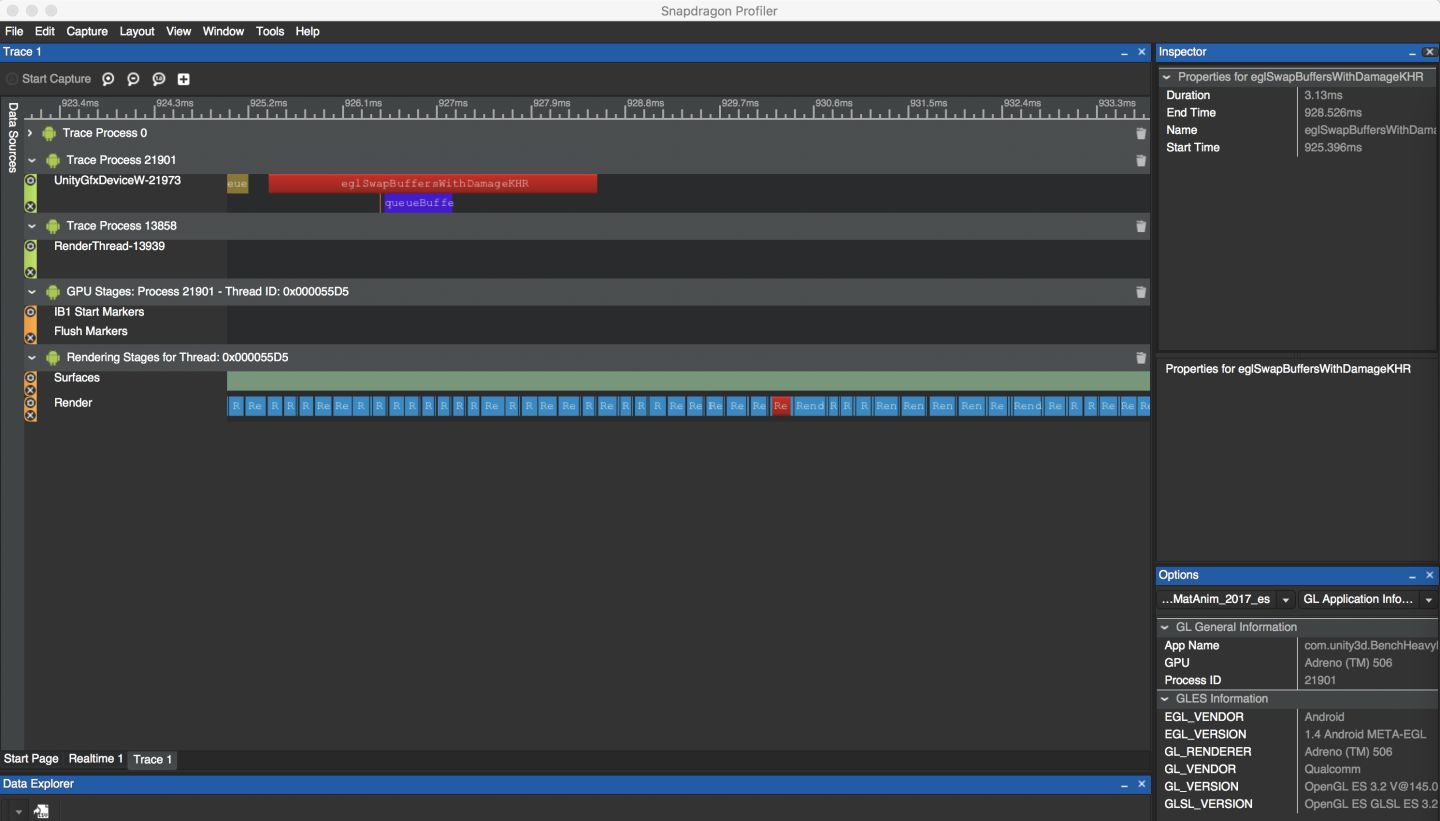
Similar to Unity’s Profiler, we can also zoom and select a specific call. And there is an inspector window on the right, you can view the specific information of the call.
0x06 Snapshot Capture
Snapshot Capture is a very powerful tool for analyzing the rendering pipeline, but it is a pity that the current Snapshot Capture funciton only supports OpenGLES, and app with Vulkan can not use the Snapshot Capture function at present.
Snapshot Capture is one of my favorite features - it can even provide a rendering history of each pixel.
Starting a Snapshot Capture is very similar to starting a Trace Capture, which can be started either in StartPage or in the Capture menu.
Just click the Take Snapshot button and wait for the data to be transferred, then the various rendering data of the current frame will be displayed.
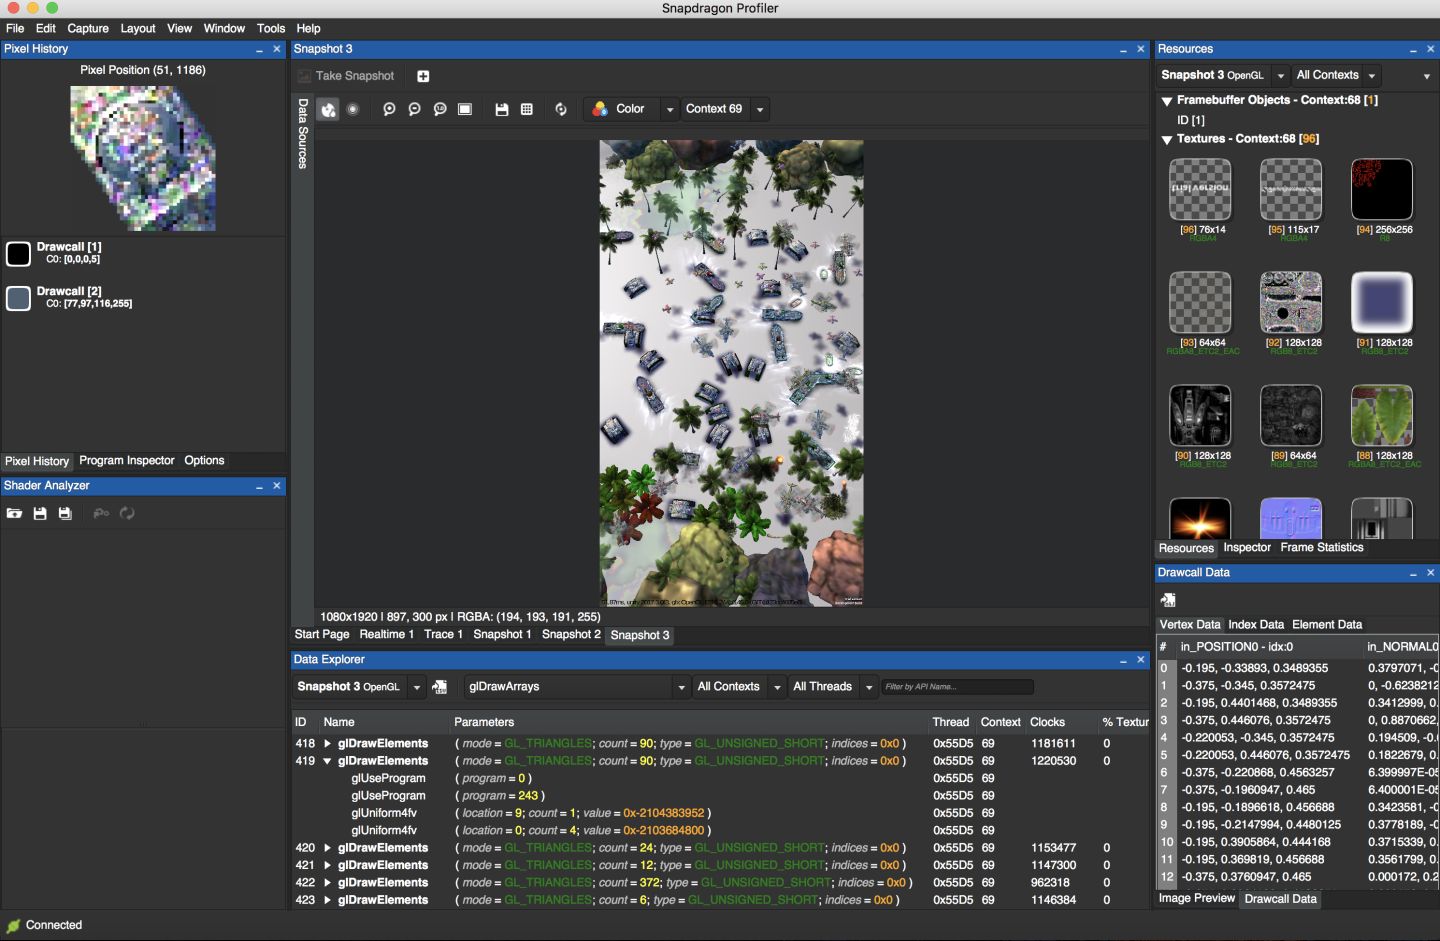
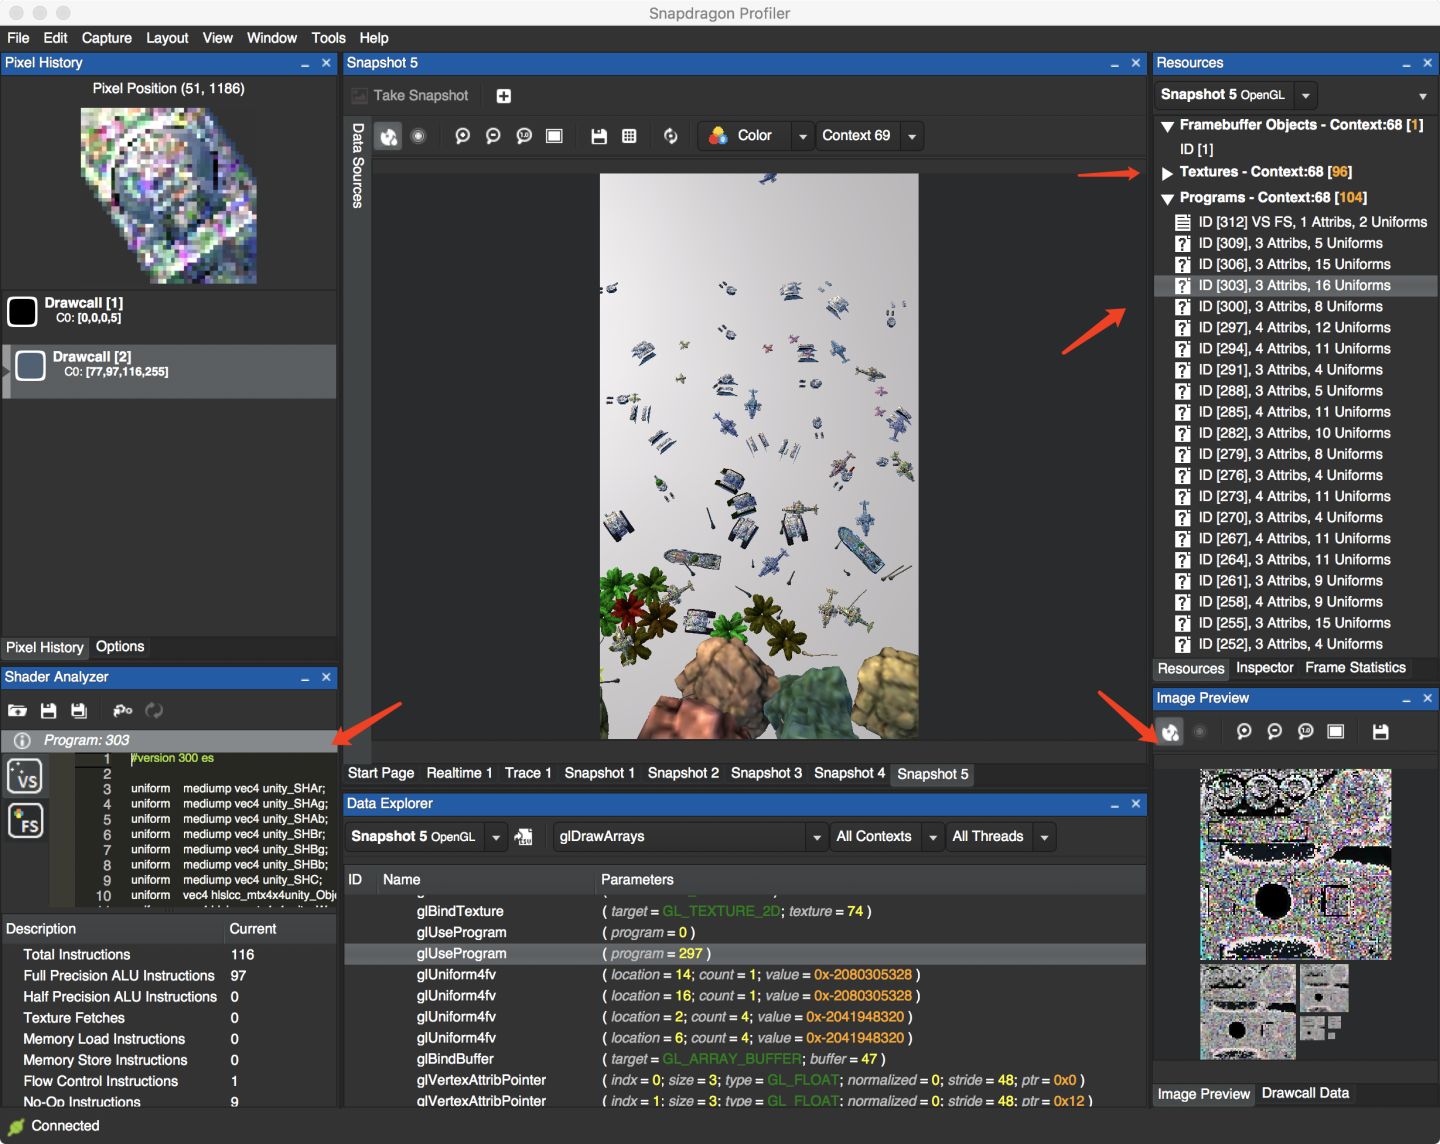
The captured image is displayed in the middle of the page. After clicking a pixel of the image, the Pixel History window in the upper left corner shows the history of the pixel.
At the bottom of the page is the gl command. Click on a draw command to view various data of this draw, such as vertex data, index data, etc.
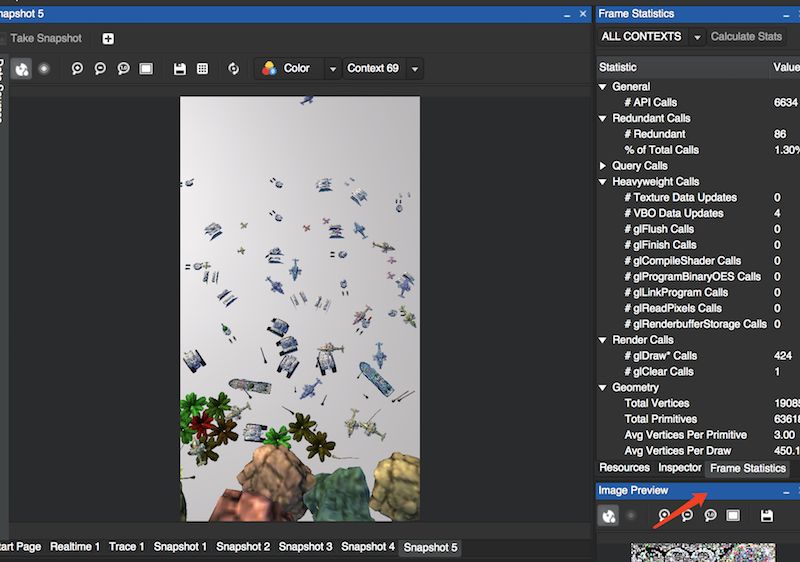
The upper right corner of the page provides the current Resource and analysis data of the current frame.
The Resource includes various textures, various buffers, and even shader programs. Click the corresponding shader under the program entry to directly view the contents of the shader.
0x07 Vulkan?
Finally, briefly talk about Snapdragon Profiler and Vulkan.
First, as an alternative to Qualcomm’s Adreno Profiler, Snapdragon Profiler supports Vulkan. However, not all features can be used to profile a Vulkan app and the current version requires the device to be rooted for profiling Vulkan app, so some devices that are not easy for rooting will be more troublesome.
Qualcomm staff mentioned the reason on the Qualcomm Developer Forum:
Unfortunately loading the Vulkan layer requires setting Android’s SELinux module to permissive mode, which requires root permissions on your device. We hope to provide a path for Vulkan profiling without root permissions in in the future, but for now you will need a rooted device.
Therefore, I hope that Snapdragon Profiler will provide a easier way to profile Vulkan app and Snapshot Capture function should provide support for Vulkan.